Richest Cities in New Hampshire (2026)
by Kristen Carney
Updated: February 9, 2026
Richest City in New Hampshire
The richest city in New Hampshire is Sugar Hill in Grafton County with an average household income of $266,685 as of 2024. While exceptionally affluent, Sugar Hill only has a population of 658 as of 2024. The richest city in New Hampshire with at least 5,000 people is Hanover in Grafton County with an average household income of $231,734 as of 2024 and 11,685 people as of 2024 according to the most current Census data available (citation).
| Rank | City | County | Population | Average Income | Median Income |
|---|---|---|---|---|---|
| 1 | Sugar Hill | Grafton | 658 | $266,685 | $154,091 |
| 2 | New Castle | Rockingham | 827 | $256,186 | $176,953 |
| 3 | Hanover | Grafton | 11,685 | $231,734 | $169,583 |
| 4 | Windham | Rockingham | 16,038 | $231,099 | $189,583 |
| 5 | Hollis | Hillsborough | 8,603 | $226,725 | $168,883 |
| 6 | Rye | Rockingham | 5,611 | $222,044 | $140,655 |
| 7 | Hopkinton | Merrimack | 6,037 | $215,974 | $137,477 |
| 8 | Newfields | Rockingham | 2,023 | $215,745 | $197,885 |
| 9 | Bedford | Hillsborough | 23,746 | $212,388 | $167,418 |
| 10 | Hampton Falls | Rockingham | 2,328 | $210,845 | $166,157 |
| 11 | Lyme | Grafton | 1,710 | $209,856 | $133,906 |
| 12 | North Hampton | Rockingham | 4,543 | $207,392 | $146,458 |
| 13 | Brookline | Hillsborough | 5,736 | $204,597 | $171,046 |
| 14 | Greenland | Rockingham | 4,106 | $203,461 | $162,837 |
| 15 | Bow | Merrimack | 8,335 | $203,343 | $172,857 |
| 16 | Langdon | Sullivan | 805 | $198,805 | $97,917 |
| 17 | Kensington | Rockingham | 2,009 | $195,564 | $165,083 |
| 18 | Auburn | Rockingham | 6,119 | $194,494 | $153,253 |
| 19 | Brentwood | Rockingham | 4,641 | $192,189 | $165,509 |
| 20 | Mont Vernon | Hillsborough | 2,636 | $191,951 | $158,036 |
Median Income versus Average Income: Which Should You Use?
We usually suggest using median income data – either instead of or in addition to – average income data as a true indicator of wealth. If you haven’t thought about median versus average since your last standardized test, you aren’t alone. Here’s what they are:
- average is the sum of a set of numbers divided by the count of numbers in the set
- median is the middle number in the set of numbers
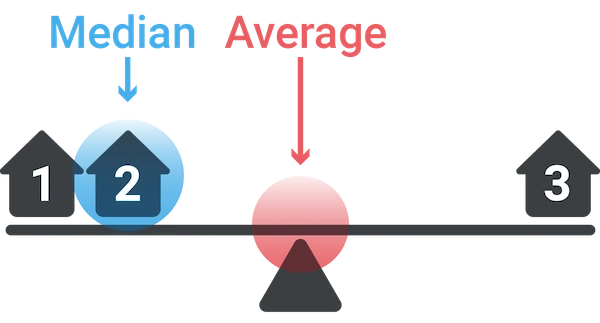
Now let’s say you had the following simplified set of income data.
Household 1: $30,000
Household 2: $50,000
Household 3: $1,000,000
The average income for this set is $360,000. The outlier data point ($1,000,000) skews the average WAY up. Conversely, the average income would be skewed WAY down if someone had an income of $500. The median income for the same data set is $50,000. Outlier data doesn’t skew the median.
Most Business Owners Should Use Median Income
So most business owners should use the median income as a true indicator of wealth, because it provides a more accurate representation of a typical income, especially in areas with significant income disparity.
When Should You Use Average Income
If your target market is high-income households, the average income may be more relevant. This is because the average income can highlight the presence of a higher concentration of wealthy individuals, which is beneficial for luxury goods and services marketing. We’re using average income on this page because using the Census’s highest reported median value of $250,001 could result in multiple ties for the richest geography.
Why do so many cities have a median value of $250,001?
The Census' American Community Survey uses $250,000+ as a jam value for median income estimates to protect privacy, ensure data consistency, and simplify reporting. A "jam value" in survey data refers to a placeholder or default value used when actual data points are unavailable, incomplete, or exceed certain thresholds. We represent this jam value as $250,001 to make it easy for you to sort.
You might also be interested in:
Email Me When New Data Are Released
Join thousands of subscribers and receive just 1 (ONE!) email a year in December when the US Census Bureau releases new income data for New Hampshire richest cities.
SOURCES
United States Census Bureau. Annual Estimates of the Resident Population: April 1, 2020 to July 1, 2023. U.S. Census Bureau, Population Division. Web. May 2024. http://www.census.gov/.
United States Census Bureau. B01001 SEX BY AGE, 2024 American Community Survey 5-Year Estimates. U.S. Census Bureau, American Community Survey Office. Web. 29 January 2026. http://www.census.gov/.
United States Census Bureau. B19013 Median Household Income, 2024 American Community Survey 5-Year Estimates. U.S. Census Bureau, American Community Survey Office. Web. 29 January 2026. http://www.census.gov/.
United States Census Bureau. "DP03 SELECTED ECONOMIC CHARACTERISTICS." 2024 American Community Survey 5-Year Estimates. U.S. Census Bureau, American Community Survey Office. Web. 29 January 2026. http://www.census.gov/.
Products & Services
Plumbing
Connect
- 1-800-939-2130
- Contact Us
© Copyright 2026 Cubit Planning, Inc.